This is part 3 in my Troubleshooting Coldfusion Performance series. It was briefly interrupted by a great trip to CFUnited 2009, then catching up, but here it finally is! Several folks approached me at CFUnited with encouragement and enthusiasm for this series, I cannot tell you how much I appreciate that! I’m glad I can finally give something back to a community that has given me so much over the years!
As this is part 3, you will most likely want to take a quick read over the 1st 2 posts in this series.
- Troubleshooting Coldfusion Performance: The Problem
- Troubleshooting Coldfusion Performance: The Analysis
So at this point, we have isolated and resolved a SQL performance issue using some of the tools that come with MS SQL. While this does not mean that our SQL configuration is now completely optimal, it has resolved the largest issue we are observing here, so we move on. Now its time to tackle our out of memory issues.
When your system is getting an Out of Memory exception, it can actually make it easier to debug than errors that only happen sporadically. There is a jvm argument that you can add to your jvm.config file that will cause a heap dump to be generated every time your server runs out of memory. Add this argument to your jvm.config file:
-XX:+HeapDumpOnOutOfMemoryError
Once you have this argument added, restart ColdFusion. Then you have the fun part of waiting for (or causing) an out of memory condition to occur. For Project X, we have 4 servers in our cluster, so we will add this argument to 1 server and bring it back into the cluster. Once it runs out of memory, the server will take a few minutes to shut down after it crashes, as it will build a text file in your {coldfusion}/bin folder with the contents of your memory at the time that the server went crashed.
Now you have a file, but if you tried to open your file in notepad, you may cause yourself more issues (the files are most often hundreds of megs, if not gigs in size). There are several tools you can use now to open your heap dump and identify possible memory leaks. Here are 3 that I find myself using.
- Netbeans– Neatbeans is a full java IDE with tons of plugins, and includes a memory profiler and tools to view and explore a heap dump.
- VisualVM– VisualVM is a tool dedicated to profiling, monitoring, and analyzing java application performance.
- Memory Analyzer (MAT)– MAT can be run standalone or as a plugin integrated to Eclipse. MAT has a slick feature that will automatically try to analyze a heap dump to find possible memory leaks. While it has been hit or miss for me with ColdFusion code thus far, it has some great reporting and can make the heap dump a bit less intimidating.
So, this being a hypothetical project and all, I wrote a quick test case to show a simple memory leak. You can download it here and check it out yourself to verify that these methods work for tracking down objects that are staying in heap too long. After one request of the index.cfm file in my sample, capture a heap dump from within VisualVM. Load it up, and switch to ‘classes’ view. On the bottom of the classes view, you will see a filter. Type in ‘cfl’ then click the green check-mark. All of the CFC’s you create that go into memory are prefaced by ‘cf’, followed by your filename, then some compiler hash looking string of letters and numbers. In this simple test case, we are looking for ‘leaky.cfc’, so filtering on ‘cfl’ will find them. After 1 request, we will see something like the following.
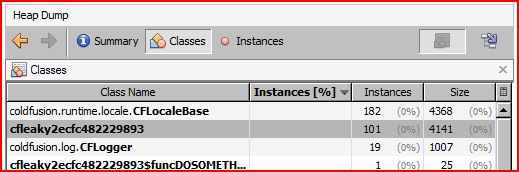
Notice that the cfleaky2ecfc482229893 object shows 101 instances in memory. The 1 instance is our ‘application’ scope variable, and the 100 instances are as a result of us running ‘doSomething()’ against it. When you run the index.cfm file another few times, then capture another heap dump, you see something like this:

So lets say we are observing this on projectX, where we have a class file that its instances count keeps growing like this on every request. This can obviously start chewing up memory, and even after 20 minutes this memory did not get reclaimed in my local tests. Now, in ProjectX, our codebase will obviously be much larger than the 3 files in my test, and isolating the code that creates this object would be much harder than looking at 10 lines of code. To help us isolate this, we will use another technique I blogged about here, using hprof with ‘sites’ to show objects that are in heap, and their stack trace associated to their creation. For those who have not used a stack trace, its basically a road map on how the object in question was created. Think of a request, where one method calls another, which in turn calls another, and so on. Each method request will be a line item in your stack trace, which will eventually show you a file from which your object was created. After you stop your ColdFusion instance, you will get a file that is named {coldFusion root}/bin/java.hprof.txt. On my test, after making 20 requests or so, the file generated was about 32 megs in size. When you open it up, you will see a ton of stack trace objects at the top of the file. Scroll ALL the way down till you get to a list of classes and their count of instances in memory, and you will see:

I highlighted 2 items here, the right most one is the class name (the name of the compiled template called leaky.cfc), and the number to the left of it is the stack trace index. Copy that number 368230 into the clipboard, then search for it in this file (above the list we are looking at now). You will come to the stack trace that created this object, which looks like:

This technique can help you quickly locate the source of leaky objects. Sometimes you will have to alter the depth of the stack trace to properly locate your object (this was run with a depth of 6, so it shows only the most recent 6 method calls). In this very simple test case, changing line 5 of index.cfm will resolve the extra objects in memory.
Before: cfset request.leaky = application.leaky
After: cfset request.leaky = duplicate( application.leaky )
This simple example is just an illustration of how you can get yourself into trouble when pointing a reference to objects from a shared scope like application or server, into a local scope like request. When we make a link from the request scope into the application scope, it maintains a reference such that the request variable would never go away until the referencing application variable gets garbage collected (which would wait for the application timeout). By duplicating the object into the request scope instead, this ensures there is no reference to the application scope variable, which allows it to be cleaned up after the request completes.
This technique is great for identifying poor code practices, or errors in your objects. With ProjectX, this technique will let you find and squash any memory leaks that are present. Running this through several times until you no longer observe a constantly growing heap size will eliminate your memory leak, and let us proceed to other issues!
Next post I will talk about the iterative process of tuning your JVM configuration, using jmeter to simulate load while you observe some of your system metrics.
Remember, anyone who comments on any post in this series will be entered into the drawing for an Alagad backpack, which anyone who has one can attest they are totally sweet. Please feel free to contribute here, any comments are welcome to clarify anything I left hanging, and I will try and answer any questions that are posted!

Comments on: "Troubleshooting ColdFusion Performance: Analysis Part II" (8)
Your ‘Before’ and ‘After’ code samples aren’t displaying in Firefox.
LikeLike
Sorry about that, fixed up now. Basically just doing a duplicate on the object to move, rather than referencing it directly.
LikeLike
Hi Chris,
Thanks so much for the excellent posts in this series and your many other thorough entries.
I’ve got your example running on ColdFusion 9 on CentOS 5.3 using JRockit Misson Control for its memleak analysis. Sure enough, cfleaky2ecfc jumps right to the top of the trend analysis. Sweet.
One small note, application.cfc must be renamed Application.cfc for Linux/Unix.
Thanks again!
LikeLike
Thanks for this great post. I had been wondering how to use all the new memory and profile tools that were out there. In the past I had a hard time getting them working with CF but with JVM 1.6 they have gotten a lot better, particular VisualJVM.
LikeLike
Hi, I would appreciate some help on visualJVM config to debug CF, or NetBeans, I’ve not able to find docs and I’m stucked with a memory problem with CF7
regards
LikeLike
Francisco,
Can you be a bit more specific on what needs configuring with visualVM, or what issues you are running into?
LikeLike
I needed this info thanks mate
Regards
LikeLike
Hi everyone, I’ve rediscovered JRockit Mission Control and really is a great tool. After some mails I’ve understood (or I think so) that with visualVM I can do not ‘LIVE Analisys’, but post-morten because I need heap dump. With JRockit after changing CF JVM you can do live analisys
LikeLike