This is an article I wrote for my Java class at The Iron Yard. It’s being published here with permission.
If debugging is the process of removing bugs from code, then what is programming?
Undoubtably you’ve already run into a few bugs in your code. Figuring out the cause of these problems can be a frustrating and tedious experience. But, it can also be incredibly rewarding. There’s nothing quite like the feeling of finally squashing a particularly challenging bug.
As a professional programmer, you’ll be spending most of your time debugging. It’s virtually impossible to write code that works perfectly the first time. In fact, code that appears to work correctly on the first test will probably start to set off your mental alarm bells. The worry being, “what am I missing?!”
A short side trip into history:
Grace Murray Hopper is a famous female pioneer in programming. She invented the first compiler for a computer programming language. She also has the distinction of identifying the first actual computer bug. At 3:45pm on September 9, 1947, while working on the Harvard Mark II, she recorded the following in her logbook:

Hunting Bugs
Reproduce the Problem
The first thing you must do when debugging something is to reproduce the problem. It does absolutely no good to assume you know what’s going on and to start changing code willy-nilly. Instead, find a way to consistently cause the problem and then start making minute changes to see how they impact the problem.
In the professional environment it’s not uncommon to receive bug reports that read like this:
The TPS form isn’t working.
First off, this report conveys next to no information. You don’t know when the bug occurred, you don’t know what error messages – if any – the user received, and you don’t know what the user was trying to do. Effectively, you know nothing about what’s going on. So, what do you do?
Step one is to try to reproduce the problem. This is often easier said than done. What if you test the form and it works for you? Does that mean there’s not a problem? Probably not. It probably means you’re not using the application the same way the user who reported the problem was.
Gather Information
You need to become an investigator. Start by asking for more details. For example:
- What error messages, if any, were reported?
- What time did the problem occur?
- What data was being submitted to the application?
- What steps led you to the error?
- If this is a web app, what browser is being used?
Effectively, you need to determine what makes this user’s experience unique. Armed with this information, try using the application exactly the same way the user did. Perhaps this will reproduce the problem.
Unfortunately, that doesn’t always work or the user isn’t available to you or can’t provide additional details.
Be a Bug Whisperer
Approach the problem like a Bug Whisperer. Take a moment to think about what you know.
- Where does your mind naturally go when thinking about this problem?
- Are there any related blocks of code you know are complex?
- How does related logic branch?
- What does your gut say?
Using these feelings, start testing your application in ways you suspect may have caused the problem. You might get lucky and reproduce the problem. Maybe you’ll discover something entirely different. Or, perhaps you simply can’t reproduce the problem.
This type of intuition and workflow will become second nature as you spend more time programming.
Check the Logs
Complex applications usually have code sprinkled throughout to record log messages. Oftentimes these log messages are inscrutable, but sometimes you can extract useful nuggets information from them.

For example, if you know that a problem occurred around 9:15am yesterday, you could open the application’s logs and look for messages around that time. Exceptions will usually be detailed, but other informational messages might tell you what else was going on under the covers around that time.
As when you’re reproducing a problem, sometimes you need to follow your intuition. Do you see a message that sticks out to you? If so, why? What does that tell you?
Learn how to read stack traces
Error messages are usually accompanied by stack traces. Here’s a relatively simple Java stack trace displayed in IntelliJ:
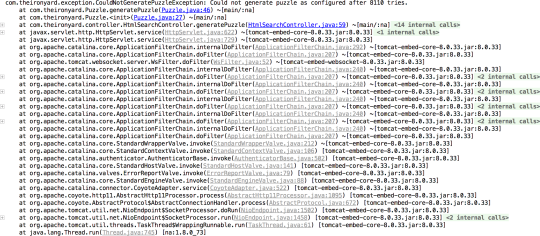
Stack traces are incredibly useful because they show you the entire stack of your application. The stack is the series of methods calls by your application. Stack traces show these method calls in reverse order, with the last method call shown at the top and the very first at the bottom. In simple applications the first method will likely be main(). In more complex applications it may be in Thread.run(). IntelliJ highlights your classes in blue and libraries in gray. This allows you to focus in on your classes. You can see exactly what line an error occurred on, as well as the sequence of method invocations that led to the failing line.
Let’s focus on the first two lines of the example above:

The first line of the stack trace shows us our error message and some detail. This is a custom exception from a demo word search application I created, so the error message is fairly descriptive. We can tell that a puzzle couldn’t be generated. However, can’t see why.
The next line immediately under the error message tells us where the error occurred. at com.theironyard.Puzzle.generatePuzzle tells us that the problem is in a class named com.theironyard.Puzzle and in a function named generatePuzzle. Following this we see (Puzzle.java:46). This is the name of the file, Puzzle.java, and the line number where the error occurred, line 46. IntelliJ is nice enough to highlight this in blue for us. Clicking on it the file name takes you to that exact line of code. File names in gray are not “our” code, but part of third party libraries or Java itself.

The next two lines follow the same basic pattern as the second line in the stack trace. Each subsequent line in the stack trace indicates a file, function, and specific line that was called by the line below it and which called the line above it.
This tells us that line 59 of the HtmlSearchController class ran the constructor of the Puzzle class. Line 27 of the Puzzle class, which is in the constructor, ran the generatePuzzle() method on the Puzzle class. Line 46 of the Puzzle class, which is in the generatePuzzle() method, is where the error occurred.
Reading backwards through the stack can help you understand where an error came from.
Another thing to watch for in stack traces are “caused by” messages. Sometimes an error occurs because of another error. The primary error you’re presented with might not make very much sense. Instead, you’ll need to go find the caused by messages and that might give you a hint on the problem.

This show an exception when trying to connect to a database server. It’s caused by a connection being refused. Knowing this, you know to try to determine why a connection might be being refused.
Code smell
As a programmer you will eventually evolve a sixth sense for code smells. A code smell is what you feel when you look at a block of code and know that it’s not very good. Perhaps it’s too complicated or convoluted. Perhaps it’s doing too much at one time. Perhaps it seems to work by magic alone.
Code smell is usually an indicator of a problem. When in doubt, consider refactoring or rewriting your code to clear the air, metaphorically speaking. Your ultimate goal is to write code that’s readable and easily understood by humans.
Squashing Bugs
Be Consistent
Once you’ve found and reproduced a bug, you’ll need to fix it. This means making changes to your code and retesting the application over and over. While you’re doing this work, be sure to be consistent in the data you’re inputting and the workflow you’re following. It’s quite possible that there are some circumstances where the problem occurs and others where it doesn’t.
Change one thing at a time
When trying to resolve a bug it can be tempting to change several lines of code before retesting your application. This should generally be avoided, especially when the code you’re changing covers more than one part of your application.
The reason you’ll want to avoid this is because it’s easy to introduce more problems. Or, if you get lucky and resolve the problem you won’t necessarily know what change was the fix.
This is true too when writing code. You should generally write one line of code, make sure that it works as expected, then write another, make sure that works, and so on.
In general, as a programmer, you need to be very slow and methodical. Go slow to go fast!
Be the runtime
When you’re debugging your code, it can often be helpful to imagine you are Java, or whatever language you’re writing. Imagine that you’re the Java runtime.
- Where does the Java start running the program?
- What exactly does Java do when a line of code is executed?
- Can you break this down into subexpressions?
- What do they do?
- What order do they execute in?
- Can you break this down into subexpressions?
- How do variables change as Java steps through the program?
- What impact does that have?
- If a line of code executes a method, where does Java “go” to find that code?
- If you execute conditional logic, given the current state of the application, what does Java do?
Effectively, for each line of code in your application, decide what Java does. Write down variables on a piece of paper and change them as they are changed.
Step debugging and watching variables
While trying to be the runtime can be extremely helpful, sometimes it can be difficult to understand what is really going on. This is where step debugging can become extremely helpful.
Step debugging is a feature of IDEs that allow you to add break points to your code. In IntelliJ you do this by clicking in the gray bar to the left of the line of code you want to stop on.

This tells IntelliJ and the debugger to pause execution of the application on that line of code, before running it. IntelliJ provides a wealth of tools to allow you to inspect your code and the state of your application at this point to better understand what it’s actually doing.
To start the application in the debugger simply click the green debug icon  .
.

IntelliJ will compile your application and start running it. As soon as Java reaches a line of code with a breakpoint, execution will be paused and you will see the following window.
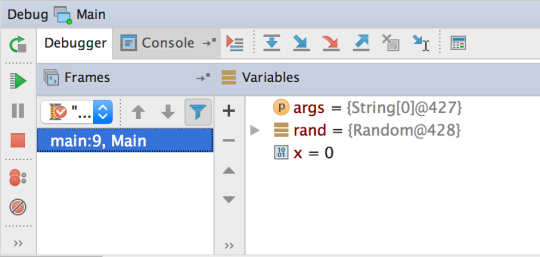
This window is broken into two panes, a stack trace on the left, and a list of variables and their values on the right. The stack in the image above only shows main because we aren’t executing any code outside of the main method in this example. The list of variables shows that we currently have args, rand, and x defined and shows their current values.
Our break point is on a for loop and has paused us before it is evaluated. We can now step through the code, line by line, and see how variables change and how execution progresses. To step to the next line of code click the step over button  .
.

This demo shows us stepping through the loop several times, one line at a time. As we progress we can see the variables in the debug pane updating. From this, we can tell that each time the loop is finished it returns to the top of the loop, executes the afterthought expression, then evaluates the conditional and, if appropriate, steps back into the loop.
But, what if we want to know what’s going on when we instantiate a Sprocket? To see that, we can pause execution on that line and click the step into  button to go into that class.
I can also click the step out  button to return to the line of code that invoked a method or constructor.

This demonstrates that Java and other programming languages literally jump to a different blocks of code when methods and constructors are invoked. When finished, execution returns to where it left off and continues on to the next line.
To see output to the console as you progress you can click on the console tab.

Step debuggers are an incredibly useful tool for figuring out what is going on in your code. Typically, in development, you will want to run your code in the debugger.
Strip out unnecessary code
Sometimes it can be difficult to figure out what’s really going on in a program. Breakpoints, wonderful as they are, can sometimes be overwhelming and confusing. There’s only so much information a mind can hold onto at any point in time. In these cases it can be useful to strip out all unnecessary code.
Let’s imagine that your application has a button. When the button is clicked your application performs 10 different things. Maybe it saves a file to disk, updates a webpage, send an email, performs a calculation, etc, etc. If you find a bug in this process, it might be useful to comment out all of the code not directly related to it.
For example, if the problem is with sending an email, do you really need to update the file on disk? Maybe, maybe not. Why not comment the code out temporarily to remove it from the process. If the problem is resolved you know that it comes from the code you removed. If the problem persists you know it’s not related to what you removed.
In some cases it might be useful to create a temporary project where you reproduce the problem using the absolute least code possible. In this context, you may be able to better see what’s going wrong.
Once you’ve stripped out all unnecessary code and things once again work as expected, add code back in, line by line or block by block. Test your application as you do so to make sure that the problem doesn’t resurface. If it does, you definitely know where it comes from.
Rubber ducky debugging
Many programmers have had an experience where they become so frustrated with a bug that they simply give up and go home. On the way home they have an existential crisis, worrying that they picked the wrong career. What happens if they can’t fix this bug? Will they be fired? Will they have to somehow make a living by playing the accordion on the street corner?
When they get home they confide their concerns to their housemate or pets. While trying to explain that they were just trying to discombobulate the retro-refractor by deionizing the mainframe, they have an epiphany! They suddenly know what’s wrong!
This experience, realizing a solution while trying to explain a problem is a common one. So, if you run into a real doozy of a problem, why bother driving all the way home to bother your dog? Just explain the problem to your handy-dandy rubber ducky!


Comments on: "Debugging Tools and Strategies" (1)
Impressive.
Sent from my iPhone
LikeLike